The State of the World’s Cash 2023. Chapter 2: CVA Volume and Growth
Summary
Key findings
- The global volume for CVA programming expenditure increased by 41% from 2021 to 2022 to US$10.0 billion, with US$7.9 billion transferred as CVA to crisis-affected people. The large-scale use of cash in the Ukraine response was a key driver of growth, but other crises also saw increases in CVA.

- CVA represented 21% of international humanitarian assistance (IHA) in 2022, compared to 20% in 2020. As a percentage of IHA, growth in the use of CVA is plateauing.
- If used wherever feasible and appropriate, CVA could account for between 30% to 50% of IHA. CVA funding to UN agencies is increasing but the visibility of implementing partners remains limited.
- Cash increased relative to vouchers as a proportion of CVA from 72% to 81% between 2021 and 2022.
- Issues affecting the growth of CVA are evolving. Economic volatility is now considered one of the most significant challenges.
- Challenges persist with consistent and timely global and response level tracking and reporting of CVA.
Strategic debates
- Is there a risk that a focus on large-scale CVA reinforces the ‘forgotten’ status of some crises?
- What should be done to realize the full potential of CVA to address humanitarian needs?
- Would more systematic collective tracking and reporting of CVA increase transparency and accountability, and improve coordination of activities?
- Is there a need to track financial assistance overall?
Priority actions
- All stakeholders should work together, across organizations, sectors, and responses, to leverage opportunities to increase the use of CVA where feasible and appropriate.
- Implementing organizations should report their programming (both CVA and other modalities) to interagency platforms, prioritizing IATI, making the necessary investments to ensure this happens.
- The global Cash Advisory Group should assign responsibilities for tracking CVA within the new cash coordination model. Sufficient resources should be identified to support CVA information management functions.
CVA volume increased, but growth as a percentage of humanitarian assistance has not kept pace
The volume of CVA1 has increased every year since 2015 (when tracking began), with 2022 marking the largest year-on-year increase. Preliminary data indicates a 41% increase from 2021 to 2022, reaching a total of US$7.9 billion transferred as cash or vouchers to crisis-affected people (see Graph 2.1). Previous year-on-year increases had been between 8% and 22%, highlighting the relative size of the growth in 2022. The estimated global volume for overall CVA programming expenditure for 2022 is US$10.0 billion2 (see Graph 2.1).

This significant increase in volume has not been matched by a similar scale of growth for CVA as a percentage of international humanitarian assistance (IHA). The significant increase of global IHA volumes in 2022 to US$47.0 billion (a jump of 22% from 2021, see Graph 2.2) partially explains this. Based on overall CVA programming costs of US$10.0 billion, CVA made up an estimated 21% of IHA in 2022, a 4% increase compared to 20213.
Given the percentage increase in CVA volume (41%), growth as a share of IHA was relatively small. Following exponential growth as a percentage of IHA between 2017 and 2020, CVA has since plateaued, with a temporary drop in 2021, following a COVID-19 related increase in 2020. Recent research concluded that if CVA were used wherever feasible and appropriate, it could account for between 30% to 50% of IHA4. Current uptake of CVA falls well below that range, indicating the barriers that remain to realizing this potential growth – explored later in the chapter.
Graph 2.2: IHA in current prices US$ billion 5

Estimated % of CVA of total IHA6
The Ukraine response drove growth in 2022, but it’s not an isolated factor.
Analysis of the causes of the record increase in CVA in 2022, based on self-reports from key informants (KIs), organizations who submitted CVA data and publicly available information, points to the Ukraine crisis and associated regional response as the single biggest driver of growth. Multiple organizations cited the impact of this, with US$1.18 billion of multipurpose cash assistance (MPC) disbursed to crisis-affected people in Ukraine in 20227. At the same time, several organizations highlighted growth in CVA in other regions, for example as part of the response to rising global food insecurity, including contexts such as Afghanistan and the Horn of Africa. In addition to these external drivers, several organizations commented on improvements to their data collection systems as contributing to higher reported CVA volumes and others cited the growth impacts of their CVA strategies.
CVA transfer volumes from UN agencies in 2022 increased by more than half (a 53% increase on 2021), for example:
- UNICEF experienced the biggest increase amongst individual UN agencies, more than doubling its volume of CVA in 2022 to US$725 million. The Ukraine response made up around 40% of this amount. A key informant noted that mainstreaming cash in the agency facilitated this growth, with approximately 43 country programmes now using CVA. Most of these are still small-scale, with around five UNICEF country programmes – including Ukraine and Afghanistan – operating at scale.
- UNHCR increased its volume of CVA transfers by 46% in 2022 to US$977 million. CVA constitutes the biggest modality in UNHCR’s portfolio, with the largest operations in the Middle East (e.g., Iraq, Lebanon), and as part of the Ukraine regional response (four out of the top ten countries by volume disbursed)8.
- WFP increased its volume of CVA transfers by 43% to around US$3.3 billion, partly due to its scaled-up CVA responses to crises in Somalia, Ukraine, and Afghanistan. CVA has remained constant at around 35% of WFP’s portfolio for the past few years. Although WFP’s support to governments and the delivery of cash via social protection systems has also increased during this time, it does not sit within current parameters for tracked humanitarian assistance (see tracking section, below).
The Red Cross and Red Crescent Movement (RCRCM) increased their CVA transfer volume by 20% in 2022, to US$1.2 billion according to preliminary calculations. A significant part of this is attributable to the ICRC, who experienced what they describe as an exceptional year in terms of CVA, marked by a 226% increase on 2021. Although Ukraine accounted for much of the growth, CVA was used across 50 delegations, including in Afghanistan and drought responses in Africa.
Across those NGOs whose data was accessible (through direct submission or from financial tracking services (FTS)), there was a collective increase in transfer volume of 23% in 2022, to US$1.5 billion. Seventy-five percent (75%) of NGOs who submitted CVA data reported an increase in volume in 2022, with a median increase of 40%. The scale of growth varied significantly, ranging between 5% and 290% increases on 2021. The other 25% of NGOs reported a decrease in volume compared to 2021. Overall, growth was neither comprehensive nor uniform amongst NGOs9. In line with the overall drivers of increased volumes, NGO respondents frequently cited the Ukraine regional response and Afghanistan as amongst their largest scale-ups, with a range of other responses for specific organizations.
As highlighted in the sections below on opportunities and challenges to growth, where crises happen, and the extent of funding provided, impact CVA volumes over time. Questions remain over whether and how long the ‘Ukraine effect’ will be maintained, and the implications for CVA volume trends in the short to medium term. At this stage, these questions are open to speculation given the unpredictability of the conflict itself. However, the scale of MPC in Ukraine in 2023 is not matching the volumes disbursed in 2022, with indications that the overall humanitarian response will also be smaller10. In the medium- to longer-term, plans are in place to facilitate a transition of the bulk of humanitarian CVA in Ukraine to the national social protection system11. At that point, these future transfers would likely fall outside of the current parameters of what is tracked as humanitarian CVA.
CVA funding towards UN agencies is increasing, but the visibility of implementing partners is limited.
In 2020, the COVID-19 pandemic helped drive a brief increase in the relative percentage of CVA that NGOs provide.12 Since then the concentration of CVA funding to UN agencies has increased again. In 2022, UN agencies and their partners programmed 66% of CVA. This is the highest share since 2017, compared to an average of 58% between 2017 and 2021 (see Graph 2.3). One partial explanation for this could be the unusually high level of demand for food assistance (including via CVA) in 2022; with WFP usually the at-scale responder in these situations, this increased their volume of CVA programming, and the concentration towards UN agencies. UNICEF’s significant increase in CVA programming is another contributing factor.
Graph 2.3 CVA % by organization type

As explored elsewhere in this report, the trend within UN agencies (and to a lesser extent, INGOs) in CVA towards more large-scale delivery seems to contradict the push to increase the role of local and national actors (LNAs) in humanitarian programming (see Chapter 3 on Locally-led response). However, the available data camouflages the contributions of implementing partners in CVA programming – many of whom are LNAs. Currently, the data attributes volumes to those who receive the funding for CVA transfers and disburse them from their accounts to aid recipients – usually via a third-party FSP. In most cases, this is the agency which receives donor funding directly but who then sub-contract many aspects to partners.
Implementing partners receive sub-grants to undertake a range of roles, from registration to monitoring, and can be responsible for many or most of the programming activities, including for interventions where the funding/intermediary organization retains the funding and responsibility for the delivery of transfers. Very limited data on humanitarian sub-grants13 (for CVA and other modalities) is publicly available meaning it is not currently possible to quantify its extent. Equally, it seems most organizations don’t track the volumes of CVA to which they contribute as an implementing partner.14All this results in a lack of visibility and underlines the importance of increasing the transparency of all downstream funding.15 16
Studies have shown that most humanitarian funding reaches LNAs indirectly17 This and the fact that downstream funding is not tracked, creates challenges in fairly showing the work of different organizations’ implementing CVA. To date, little data has been captured on CVA funding and local and national organizations’ spending, which aligns with the systemic challenges to localizing responses outlined in Chapter 3 on Locally-led response. Analysis of UN-managed humanitarian response plans in 2022 found that only 3% of CVA funding requirements were for LNAs and that these CVA projects were less likely to be funded compared to international actors’ CVA projects in the same plans18. This percentage aligns with very low levels of direct humanitarian funding to L/NNGOs in general, but as shown, does not accurately reflect their contributions to CVA, notwithstanding the issues in tracking and quantifying these.
A notable increase in the overall volume of cash vs. vouchers in 2022
After staying largely static at 71–72% for three years between 2019 and 2021, cash increased to 81% of CVA in 2022, with vouchers comprising 19% of reported disaggregated totals.
Disaggregation of cash and vouchers is a minimum requirement when tracking CVA19. This is based on recognition of the significant qualitative differences between cash and vouchers from the perspective of those receiving and using them, which includes well documented recipient preferences for cash (over vouchers or other modalities of assistance) in most cases. Associated with this, going back to at least 2015, much of the push at a policy level for CVA has been towards cash, rather than vouchers20.
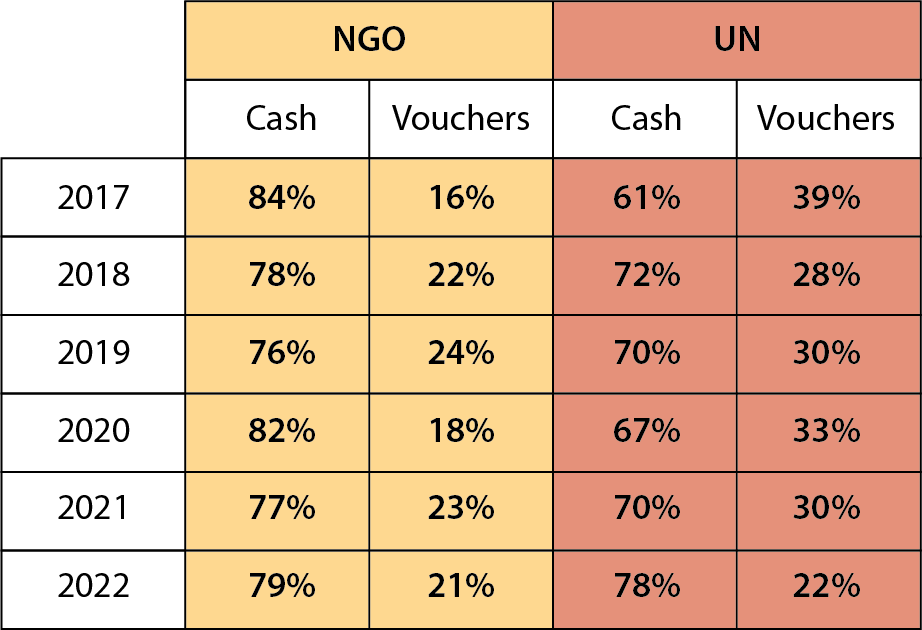
An examination of cash and vouchers as a percentage of CVA portfolios by organization type reveals that amongst NGOs this has fluctuated over the years, within a range of 76% to 84% cash. For UN agencies, the cash/voucher split had remained around 70% cash for several years, with a notable increase to 78% (cash) in 2022. There are significant differences between organizations within different categories. For example, UNHCR has consistently reported 95% cash assistance within their CVA portfolio since 2017, while UNICEF has reported between 95% and 99% cash since 2018. For the RCRCM, disaggregated data isn’t available for all years, but a concerted shift towards cash is evident – from 82% in 2017 to 98% in 2022 (based on interim figures).
Graph 2.4. Cash & vouchers as a percentage of CVA 2015-2022

Within NGOs, while in some cases there is a consecutive trend towards more cash, it’s not unusual to see shifts up and down over time in terms of the relative volume of cash versus vouchers. Feedback indicates this usually has more to do with the context of specific responses, for example where funding or other issues may limit cash assistance, rather than organizational policies favouring vouchers. The relevance of response level factors influencing modality selection was also reflected in analysis of humanitarian response plan data undertaken by Development Initiatives in 2022. There was an aggregate increase of three percentage points (to 64%) for cash components out of the total requirements for CVA projects from 2021 to 2022 across the 16 response plans analyzed. However, a “closer look at the country-specific data shows seven response plans remaining stable or increasing in their relative planned use of cash and nine shifting more towards vouchers, [with] shifts towards cash […] more pronounced and/or in larger-scale CVA responses”21. The overall shift towards cash in 2022 might be attributed in part to the large-scale use of multi-purpose cash assistance (MPC) in the Ukraine crisis response.
Graph 2.5. Cash and vouchers as a % of CVA by organization type.22
Understanding the global increase in cash vs. vouchers in 2022 requires analysis of WFP’s disaggregated data23 as they delivered 74% of all vouchers globally (based on the subset for which we have disaggregated volume data) in 2022. WFP increased their percentage of cash assistance to 67%24of their total CVA in 2022, compared to 57% in 2021. This constituted an increase in cash volumes from US$1.3 billion to US$2.2 billion, while vouchers only increased from US$1.0 billion in 2021, to US$1.1 billion in 2022. Given the scale of WFP’s programming, this had a notable impact on the overall split between cash and vouchers at the global level. With WFP’s new Cash Policy prioritizing the use of cash (rather than vouchers), and the removal of commodity vouchers from their CVA category internally, they anticipate the relative percentage of cash assistance to increase over time, with several large responses shifting to unrestricted modalities.
There is scope to increase CVA, but perspectives on the extent and opportunities vary
The first SOWC report highlighted the 2016 research that estimated CVA could account for 37% to 42% of all international humanitarian assistance if used as the default modality wherever feasible and appropriate25 In 2022, CALP commissioned a study to assess whether this estimation still holds, if it should be updated, and what the principal opportunities and challenges are for increasing CVA. The study concluded that “… if CVA were delivered wherever feasible and appropriate, it could account for at least 30% and up to 50% of global humanitarian assistance.” The research also identified three broad approaches to increase CVA, noting that in a global context of exponential growth in needs, all three are necessary:
- Shifting the balance of existing activities towards more CVA where feasible and appropriate.
- Developing stronger links with cash-based social protection and development aid (see Chapter 6 on Linkages with social protection).
- Increasing overall humanitarian financing (with CVA increasing as a proportion of this).4
Logic suggests that we could be more ambitious in our target for cash. If we were to consider two main variables – people’s preferences and market functionality – this would give us a better idea of what the figure should be. (SIDA)
The question of whether quantitative targets for CVA are useful or not is an ongoing topic of debate. This issue was outlined in the SOWC 2020 (ref pages 34-35), and the research in 2022 found a similar mix of perspectives between those who find them effective to galvanize action, and those who favour the principle of a ‘modality neutral’ approach based on good response analysis. Critically a modality neutral approach will often co-exist with a clear commitment to the systematic consideration of CVA. Overall quantitative targets are less common than is sometimes assumed, with only 24.5% of operational Grand Bargain signatories having set one27
Where they have been set, organizational CVA targets range between 5% and 50% of humanitarian aid delivered, and can be based on multiple factors, from sectoral mandates to mindsets and exposure at the decision-making level, to risk appetite. Using available organizational targets as a basis, it is estimated that if those targets had been reached in 2021, CVA would have represented 30% of IHA (as compared to the actual figure of 17%).
“… there is no one large reservoir for growth and no simple accelerators – rather the growth potential will only be realized through multiple actions, by multiple organizations, in multiple places.” (Increasing CVA (2022) CALP)
Survey respondents for this report were asked to provide their perspectives on the biggest opportunities to increase CVA within existing funding levels, shown in Graph 2.6. Almost all (97%) respondents perceive opportunities to grow CVA within existing funding levels, which aligns with other findings.4 The overall range and spread of responses indicate that – rather than just one or two strategies that would yield large-scale change on their own – there are multiple potential pathways to increasing CVA, many of which are likely to be mutually reinforcing.
Context is a critical determining factor for CVA growth. Disaggregated analysis of the survey results shows some regional variations. Though not striking for the most part, they do point to the influence of contextual factors. For example, 33% of respondents from Asia and the Pacific selected the use of anticipatory action (see Chapter 9 on Climate and the environment), compared to 23% overall). This may reflect the relatively greater use of this approach in that region to date or greater awareness of the possibilities that exist. The importance of context in determining where and how much CVA is possible was also a key finding in recent research29. Key informants to that study pointed to examples of very large CVA interventions in places such as Türkiye and Ukraine with outsize significance within their overall CVA portfolios. There can also be important changes over time to the feasibility of CVA within a specific context, and to the levels of humanitarian need and funding available. This resonates with some of the fundamentals of evaluating where CVA is feasible and appropriate, and the fact that certain contexts – for example those with well-developed markets, financial services, and infrastructure – are more likely to be considered appropriate for large-scale cash assistance. Hence if there are major humanitarian crises in places where at scale CVA is well suited, this will impact CVA volumes, as evidenced by the Ukraine response in 2022.
Graph 2.6 Biggest opportunities for further increase of CVA within existing funding levels

Returning to the survey findings, 39% selected increasing sector-specific CVA as the biggest opportunity for CVA expansion. The potential use of CVA varies significantly across sectors, as does the level of progress and/or reticence to use it, which inevitably also varies across sector practitioners within different organizations and responses. Chapter 8 looks in depth at the status of CVA within different sectors, including in relation to MPC. A lack of comprehensive data on sectoral CVA and in-kind assistance complicates the clarity on the potential for growth in sectoral CVA. Better data could provide a baseline to understand the volumes of current in-kind transfers, determine what could feasibly be transferred as CVA instead, and enable tracking of changes.
The survey results underline the perception that strengthening capacities is central to increasing CVA (see also Chapter 5 on Preparedness and capacity). This relates to both systems and processes (35%) and staff capacity (30%). Investment in preparedness, which has capacity strengthening as a core component, is also seen as a good opportunity for growth, cited by 32% of respondents. This includes the proposition to increase CVA ‘pre-positioning’ relative to in-kind stocks. It isn’t currently possible to calculate what this might mean in terms of additional CVA as there is no collective tracking of pre-positioned goods against which to do this29. However, issues such as the visibility of in-kind assistance can act against a switch to more CVA, while feedback indicates that there are some signs of change. It has also been recommended to establish institutional dialogue between logistics and CVA actors on the topic of decreasing in-kind preparedness and increasing CVA29.
The removal of government restrictions on the use of CVA was ranked relatively low as an opportunity for growth – across all regions and groups, including government respondents. While this could imply it’s not seen as a major or perhaps widespread issue, occurrences such as the cash transfer ban in the Sahel region of Burkina Faso in 202332 brings it into focus, highlighting that government restrictions can have a significant impact within the areas affected.
Donors largely remain supportive of increasing CVA, but progress is not linear. Feedback from KIIs generally highlighted positive donor attitudes towards CVA, with explicit resistance being increasingly rare33. Some key informants noted direct influence from donors to do more cash, although one from a UN agency also remarked on greater flexibility, with less push towards specific modalities and more unearmarked funding. This aligns with the observation that donor commitments to provide more unearmarked funding as part of the Grand Bargain may not always align with commitments to scale up cash. Some donors, however, do simultaneously encourage the systematic consideration of cash34. Key informants also noted that some donors can be broadly cash positive, except for its use in specific sectors – for example, more than one major donor is sceptical about the use of cash for health, particularly the incorporation of medical expenditures within MPC. Another key informant reflected that where donor policies favour MPC, this can be challenging for agencies with sectoral mandates (see Chapter 8 on CVA design).
Some key informants mentioned ECHO’s 2022 policy guidance for cash transfers35 as being influential and useful in terms of consolidating lessons learned. Several key informants also commented that USAID/BHA has become more active and supportive of CVA. GFFO commented that they remain committed to CVA, based on strategic analysis and appropriateness. SOWC 2020 highlighted the UK as one of the two most prominently pro-cash donors, but at least one key informant commented that their position regarding cash assistance was now much less clear, and that they were unlikely to reach their 2025 target of 32% CVA. In addition to the role of institutional donors, key informants from the Red Cross Red Crescent also noted that more private and philanthropic donors, including those locally, are doing more cash, with the COVID-19 response cited as a likely positive influence.
Graph 2.7 Donors work effectively together to facilitate improvements in the quality and scale of CVA

There is scope to improve donor collaboration36 to improve scale and quality. Fifty-one percent (51%) of survey respondents agreed that donors work effectively together to facilitate improvements in the quality and scale of CVA. This result was consistent (within a range of a few percent) across most types of respondents including donors. The sense that donors themselves perceive significant scope for improved collaboration was also reflected in their responses to the survey question on opportunities for growth, where the largest percentage of them (44%) selected better donor collaboration as a key opportunity. This compares to 27% of respondents overall. While more flexible funding was in the top four opportunities to increase CVA for respondents overall with 32%, only 19% of donors who completed the survey selected this. Donors were also significantly more likely to identify cost savings through efficiencies as an opportunity to increase CVA (34%) compared to the respondent group overall (20%). These results indicate differences between donors’ and operational agencies’ perspectives in terms of what is likely to be most effective and feasible to increase CVA.
Funding flexibility, or lack thereof, is relevant to how far donors predetermine modality choices within certain funding streams, and the potential impact this could have on CVA volumes. For example, a thought experiment, about how much CVA would increase as a percentage of IHA if the entire USAID Title II budget36 was delivered as CVA, concluded that if this had been the case there would have been substantive growth (e.g., up to approximately 25% of IHA in 2021, compared to the 19% in practice). The relative impact on CVA volumes would be greater in some countries than others as Title II is only used in a small number of countries where it is considered an appropriate option due to market and feasibility factors4.
As a form of humanitarian assistance, inevitably much of the focus on increasing the scale of CVA is on the extent to which this can be achieved within the parameters of existing humanitarian funding and systems. Some argue that this focus risks missing relatively greater opportunities to increase CVA – through linking humanitarian CVA with national social protection (see Chapter 6 on Linkages with social protection), and, often in association with this, by tapping into new sources of financing, such as international financial institutions (IFIs), climate financing, and domestic funding for social protection. Evidence for this includes examples where funding from IFIs for government assistance via social protection systems during humanitarian crises far exceeds CVA provided by humanitarian organizations (e.g., Sri Lanka and Pakistan in 2022)39.
Issues affecting the growth of CVA are evolving
As with previous State of the World’s Cash reports, survey respondents identified a range of issues as the biggest challenges to increasing CVA (see Graph 2.8). This underlines the diverse factors influencing CVA, many of which will vary in importance by context, and over time. For example, case study analyses exploring factors affecting CVA growth in several countries outlined a complex mixture of issues, including funding, donor preferences, organizational capacities, infrastructure, systems, inflation, liquidity, government policies, coordination, programming agility, and linkages with social protection and development programming40. However, the survey results also demonstrate that, overall, some issues are more commonly experienced than others, while comparison with previous reports shows that the issues affecting the growth of CVA are evolving. Combined, these shifts reflect both the geo-political context of many crises (global, regional, and/or country-specific), and possible evidence of progress in addressing some long-standing challenges.
Graph 2.8 Biggest challenges to increasing CVA

Key findings are summarized as follows:
Funding constraints on CVA are now perceived as a more significant challenge than in 2020. Limitations on humanitarian funding for CVA was one of the top two challenges cited in the survey, by 33% of respondents. This compares to only 21% of respondents that considered inclusion of CVA in humanitarian funding processes as a top challenge in 2020. Constraints on funding for CVA can be situated within the context of the increasing strain on humanitarian financing in the face of escalating needs. The number of people in need of humanitarian assistance in 2022 grew by a third, to an estimated 406.6 million people41. Despite a significant increase in humanitarian funding in 2022, largely due to the Ukraine crisis, the gap between needs and resourcing is increasing42. Funding shortfalls vary from response to response, with some such as Ethiopia, Syria, Yemen43, Myanmar, and Venezuela receiving only around 50% or less of funding requirements in 2022, how far this is perceived as a major challenge to CVA will likely be influenced by context of operation. It isn’t only an issue of resource constraints per se, but also of donor policies and funding models. Feedback from key informants highlighted the largely positive role and positioning of donors with regards to CVA, it’s also notable that 32% of respondents saw more flexible and unearmarked, funding as a big opportunity to increase the volume of CVA (see Graph 2.6 – on opportunities for growth).
One risk that is specific to CVA is inflation and that is here to stay. We have put a lot of effort recently into being able to do CVA in the context of inflation, for example working with central banks, working around regulations. (WFP)
Economic volatility is now considered one of the most significant challenges to the growth of CVA. While economic volatility (e.g., currency fluctuations, inflation, depreciation) was clearly a concern in some countries (e.g., South Sudan, Zimbabwe, Venezuela) in the 2020 State of the World’s Cash report, it did not register as a particular challenge to CVA in the overall data collection and analysis. However, in 2022/2023 with, for example, inflation rates in many countries are at their highest rates for at least a generation, economic volatility is perceived as both a major obstacle to growth, and a major risk to the implementation of CVA. The nature of economic volatility in any given context is critical in determining whether the feasibility and appropriateness of cash or vouchers is fundamentally affected in practice (see section on risk below for more). Greater economic volatility can add layers of complexity to implementing effective CVA, which might conceivably discourage practitioners. However, it has been argued that in most cases doing cash assistance in economically unstable contexts is both possible and beneficial to affected people and communities44.
“Risk management has been very important. We have adopted a project management unit (PMU) approach to supporting COs for the largest cash interventions operated in complex environments. Without a PMU the risk appetite of senior management and donors was a bottleneck.” (UNICEF)
A reduction in the extent to which risk management is perceived as a challenge to increasing CVA indicates some progress in addressing risks in practice. Only 31% of respondents ranked management of risk as a challenge, compared to previous practitioner survey results in 2018 (41%) and 2020 (40%). Several key informants cited one factor that might partially explain this: the importance of investment in systems and preparedness to address potential risks. This included UNICEF, who emphasized the importance of these investments to manage risk appetite amongst senior management and help facilitate the scale up of cash assistance. A WFP key informant also observed that while the types of risks faced haven’t changed, their preparedness to manage them has increased drastically. Other research also found evidence of progress within organizational policies and systems to manage operational risks27.
Capacity limitations are seen as less of a challenge overall compared to 2020. Twenty-seven percent (27%) of respondents in the 2023 survey cited capacity limitations in relation to systems/processes as the most significant constraint to CVA growth compared to 42% of respondents in 2020. There has been a similar reduction in the perception of human capacity as a constraint to CVA, with only 17% of respondents citing it in 2023 compared to 35% in 2020. As reported in Chapter 5 on Preparedness and capacity, most respondents (88%) felt their organization has increased its CVA preparedness over the last few years.
A lack of multisector assessments is considered a less significant challenge to growth. Only 18% of respondents cited this as a major challenge to the growth of CVA in 2023, compared to 29% in 2020. It’s difficult to ascertain if this is because the use of multisector assessments is perceived to have increased, or perhaps because there are more and more pressing challenges that have pushed it down the ranking. In specific reference to MPC, a lack of systematic multisector assessment and response analysis is still perceived as the most significant obstacle – 58% of respondents cited this (see Chapter 8 for graph and more on issues affecting the use of MPC).
Tracking CVA is useful, but challenges with consistent global reporting persist
“Tracking the volume of CVA is useful, but quality information management and monitoring is much more important for quality CVA.” (UN Agency)
Key informants that commented on tracking CVA were largely positive about the potential and realized benefits. Much of this feedback, which correlates with other recent research29, relates to the role of tracking data for internal and external advocacy, learning, visibility, and accountability – usually concerning the use of data at a global or strategic level – e.g., relating to funding or policy – rather than at the operational and programming level. This corresponds with one of the main initial objectives of improved tracking, to enable greater accountability against commitments to increase the use of CVA where appropriate and feasible. However, this type of tracking is less useful to achieve the other main objective of improved CVA data: to enable better coordination of CVA and other modalities during a response, in real-time, based on data on who is doing what and where47 (more on this below, on response level data collection).
“It is a huge process to aggregate and clean the data. But it’s massively useful as we see a transformation for our discussions with other humanitarian actors including the UN and donors as a result. It’s led to much greater transparency about who is really doing what”. (IFRC)
Recent research has highlighted that there is a perceived tension between the commitment to improve the tracking of CVA and the commitment to reduce the reporting burden27. So far as this tension is felt, it doesn’t necessarily seem to have discouraged agencies from taking steps to improve tracking. There is evidence from key informants, submissions to CALP and DI’s annual CVA data collection, and other research39, of ongoing investments since 2020 in improved reporting systems, including aspects such as extracting sub-grant data, and the development of dashboards. Yet difficulties in accurately tracking CVA50 remain, both internally regarding organizational systems, and externally regarding reporting to interagency platforms.
In 2020, Tracking Cash and Voucher Assistance: Agreements, recommendations, and minimum requirements from the Grand Bargain cash workstream51, was published (see Box 2.1 for a summary reminder of the key requirements). In 2022, Development Initiatives published a detailed analysis of the status of tracking CVA52, including with respect to meeting minimum requirements. The key findings of that report regarding progress in reporting to interagency platforms are summarized in Box 2.1, which underline the fact that this remains patchy and inconsistent despite the existence of required reporting categories. It is also notable that in recent years various organizations, particularly some of the largest CVA implementers, have developed their own CVA dashboards and reports. The focus on these more internal mechanisms, rather than feeding data into publicly accessible, global reporting platforms could indicate those organizations’ primary use of this data is to improve their internal decision-making and their individual visibility towards donors, over leveraging it for a better coordinated or more transparent interagency humanitarian response.
Box 2.1: Minimum requirements for tracking CVA (Grand Bargain Cash Workstream)
• CVA should be disaggregated into cash and vouchers in the tracking of humanitarian assistance.
• The value of transfers to recipients should be the primary indicator for tracking cash and vouchers.
• Reporting on all humanitarian CVA activities should include the objective, either sectoral or cross-sectoral (multi-purpose).
Box 2.2: Tracking CVA – Status of Reporting CVA to global Interagency Platforms
(adapted from Development Initiatives – Tracking Cash and Voucher Assistance (2022))
UN OCHA Humanitarian Programme Cycle (HPC) tools
- UN OCHA included a standard set of questions on CVA in its Projects Module in 2019. This data provides an overview of CVA requirements for plans with a project registration process. UN OCHA’s Financial Tracking Service (FTS) data can, in theory, then be used to match funding flows to projects with CVA components.
- This is currently the largest amount of granular and timely data on humanitarian CVA reported to interagency platforms. However, it only represents a subset of the total CVA volume. For example, in 2021 CVA requirements that could be identified through the available response plan data were less than half the annual total calculated by CALP/DI. There are also challenges in matching funding flows in FTS to response plan data (e.g., missing project IDs, estimated or changing CVA requirements) which affect accuracy.
- Those reporting to FTS can also directly tag a funding flow as having a CVA component, but this is rarely done. It is also impossible to disaggregate the data or effectively quantify the percentage that was disbursed as CVA.
- These challenges arise largely from the fact that neither FTS nor the Projects Module were designed with the objective of tracking expenditure on different modalities. It also remains the case that reporting to these platforms may not be consistent nor complete across and within organizations.
- To meet minimum reporting requirements on CVA it would be necessary to systematically integrate data collection with monitoring information systems (see section on country level response) and to better link those with planning and resource mobilization data.
International Aid Transparency Initiative (IATI) Standard
- The IATI Standard introduced the option to publish disaggregated data on CVA for projects and funding flows in 2019. Within the structure of the IATI Standard, CVA data can be published at both the ‘activity’ level (allows a project to be tagged as including cash and/or vouchers), or ‘transaction’ level (allows disaggregated project expenditure data to be published, which can fulfil the minimum CVA reporting requirements to track transfers to recipients, disaggregated by modality). Sectoral objectives can also be reported, but there is no cross-sectoral category that would capture MPC.
- Many (but not all) agencies that implement large amounts of CVA are already publishing data to the IATI Standard for other purposes. However, even though the option to publish CVA data was introduced nearly three years ago, it has hardly been used.
- For organizations with centralized project reporting and CVA monitoring systems (e.g., WFP, UNHCR) incorporating information on CVA transfers when publishing expenditure data to IATI might be relatively straightforward. For organizations with a network or confederated structure where individual affiliates or national societies would need to publish data to IATI directly, this would be more resource intensive, requiring IATI reporting to be rolled out across affiliates, including guidance on incorporating CVA data. However, there are opportunities for organizations to streamline the reporting of aid activities within IATI. Published only once, this data can then be used multiple times – e.g., reporting on funding progress against response plans, for coordination efforts, and donor reporting.
The Tracking CVA report also highlights that many donors still struggle to track their funding for CVA. Although there have been efforts to address this, with some such as USAID and EC Directorate-General for European Civil Protection and Humanitarian Aid Operations (ECHO) able to retrospectively quantify CVA funding. Donors generally rely on their implementing partners to report CVA data back to them, with additional complications for pooled funding mechanisms, and unmarked/flexible funding.
While the inclusion of standard questions on the value of assistance by modality in the 8+3 Reporting Template should in theory have improved reporting to donors on CVA, there are issues of compliance with the template (which is often only applied to NGO and not UN partners). As a result, donors’ ad-hoc CVA tracking exercises are still often required, which can entail a considerable level of effort53. Standardized reporting on CVA to interagency platforms in accordance with the minimum requirements would help to address the data gap between donor funding and quantities delivered as cash and/or vouchers. It could also potentially alleviate the reporting burden for partners if they publish data on modalities in a centralized manner instead of needing to report separately to different donors.
CVA data at response level is rarely available close to real-time
Facilitating better coordination of activities has long been an objective of improving the availability and accessibility of CVA data. This is most relevant at the country or response level, with the primary information management tool for this purpose being UN OCHA’s ‘Who does What Where’ (3Ws). In 2020, UN OCHA introduced a new global template incorporating standard fields for delivery modality (cash, voucher, in-kind, service delivery) and transfer values, which align with the CVA minimum tracking requirements. There are also optional fields including on, e.g., conditionality, frequency of transfer, and CVA delivery mechanism. However, this decentralized reporting system which allows country-level teams and clusters to decide which standard fields to include in their 3Ws means data on delivery modalities is not consistently reported nor included in the Global 3W dashboard. As a result, cash working groups (CWGs) generally continue to collect response-level CVA data, often via a separate reporting process54, with no global consolidation of this data.
Development Initiatives52 examined available CVA data in 2022 from CWGs and concluded that CVA data is collected in all major humanitarian responses and largely meets the minimum requirements. However, accessibility and timeliness are not consistent. At the time of analysis, only three contexts (Ukraine, Somalia, and South Sudan) provided publicly available CVA data for the current or previous quarter. Only two of those contexts (Ukraine and Somalia) published granular data on who is doing what, where, with other responses usually publishing aggregated data. This in turn limits the extent to which this data can support the coordination of activities.
“Situating the responsibility for tracking CVA at the response level within the new cash coordination model provides an opportunity to generate comparable and better-quality data on CVA […] (which) could then be reflected on interagency reporting systems.”
Development Initiatives – Tracking Cash and Voucher Assistance (2022)
The same study also highlighted a “disconnect between response-level and global, interagency reporting on CVA, with data from the former not reflected anywhere in the latter”. It concludes with recommendations for the Global Cash Advisory Group (CAG) to agree CVA tracking responsibilities for CWGs and clusters as part of the transition to the new coordination model (see Chapter 4 on Cash coordination), and for donors to ensure sufficient resources for CVA information management.
Tracking government-led social assistance in relation to humanitarian CVA
The State of the World’s Cash 2020 highlighted the lack of clarity on the question of if, when, and to what extent cash and vouchers delivered through government-led social protection systems might be incorporated into the tracking of ‘humanitarian’ CVA. The intervening years have increased focus on the linkages between CVA and social protection, particularly with the large-scale use of cash-based social assistance to respond to needs during the COVID-19 pandemic (see Chapter 6 on Linkages with social protection for more on this), which included notable efforts to capture and analyze related data56 However, there’s been little substantive progress towards answering the question above. This reflects a more general issue – which varies by country – of insufficient data and/or of (international) humanitarian actors’ inattention to domestic crisis responses.
Current tracking only covers IHA funded interventions, limiting the potential to incorporate CVA funds from other sources, including development assistance, and funding from IFIs. This relates to the structural limitations of current, generally siloed (e.g., humanitarian, development) funding models, which are perhaps more visible within CVA precisely because of the linkages to social protection. There are “conceptual and practical challenges to gaining a more comprehensive understanding of humanitarian CVA transfer volumes through social protection systems”, not least “a lack of shared understanding of what the parameters are to categorize cash-based social assistance as ‘humanitarian’”39.
There are good arguments for exploring this topic further, notwithstanding the challenges noted above and recognition of the criticality of context in terms of data accessibility and categorization. This includes enabling a better understanding of the whole of cash response58and more effective coverage of needs. The 2022 Pakistan floods are a good illustration of the salience of these issues, with the Government of Pakistan disbursing close to US$300 million to affected households via the Benazir Income Support Programme (BISP). This was, by a large margin, the most significant intervention in the first months of the response but would not currently be counted towards 2022 global CVA volumes (unless, hypothetically, international donors funded it and they reported it as humanitarian assistance)59.
The inclusion of cash-based social assistance in the Pakistan Floods Response Plan in a government-led coordination effort allowed others, such as the food security cluster, to focus on complementary activities52. Based on this experience, focusing primarily on improving the tracking of social assistance (e.g., how much, where, to whom, when/triggers), rather than if, or when, social assistance should be designated as ‘humanitarian’ could simplify the tracking issue. This may not lend itself so well to better quantifying ‘humanitarian’ CVA, but it would, in theory, enable better coordinated and more complementary responses where humanitarian actors can access relevant social assistance data for planning purposes. The onus would then be on international actors involved with social protection as well as domestic governments to produce this information, and on humanitarian actors to seek it out and use it.
The potential to expand the parameters of tracked humanitarian CVA to include further categories of funding and types of intervention is also relevant to the growing focus on the use of cash in anticipatory action. Both that undertaken by LNAs, and more broadly in relation to the possible role of climate finance mechanisms in addressing humanitarian needs, arise from climate-based crises. There are also notable overlaps with the role of cash-based social assistance linked with this (see Chapter 9 on Climate and the environment).
Implications for the future: Areas for strategic debate and priority actions
Areas for strategic debate
Our analysis highlighted the following considerations to inform further thinking and progress in this area.
Is there a risk that the focus on volume reinforces the ‘forgotten’ status of some crises? Analyses of volume and scale perhaps inevitably skew towards emphasizing size – e.g., the agencies providing the largest volumes of CVA, and the responses where the most assistance has been provided. This is understandable, but it is also a lens that can limit the visibility of and reinforce the status of some crises as ‘forgotten’. This is important where we acknowledge that levels of funding (including for CVA) to responses do not necessarily have a direct correlation with levels of need, with some crises carrying much larger funding gaps than others. Even where a response is relatively small in global terms, this does not make it any the less important to the people in need of assistance in those places. A knock-on effect is that research and analysis of CVA is often directed towards the larger responses. These types of response generate a lot of valuable learning, innovation, but (relative) growth can also be found elsewhere
What should be done to realize the full potential of CVA to address humanitarian needs? The analysis clearly shows that there is potential to significantly scale up the use of CVA. Evidence also shows that, in most contexts, most people prefer to receive cash over other forms of assistance. As has been documented over the years, cash responses can offer efficiencies over other forms of aid. The existing structures and funding mechanisms of the humanitarian system are a barrier to increasing the scale and effectiveness of CVA. Given all this, the multiple points at which change is needed to achieve further scale-up need to be addressed.
Would more systematic collective tracking and reporting of CVA facilitate greater transparency and accountability, and more effective coordination of activities? Current tracking limitations – relating to systems, capacities/resources, willingness, and coordination of efforts – mean that the data available for CVA is not generally able to meet demands for information. Critical gaps include the flow and volume of funds to local and national actors, country- or response-level CVA volumes, and data disaggregated by sector, and for MPC. Addressing these gaps would require collective efforts but could provide valuable information to inform better coordinated responses and provide more visibility and understanding of the contributions of local and national actors. At the same time, better tracking is recognized to potentially contradict the principle of minimizing reporting requirements, particularly when humanitarian resourcing is stretched very thin. To that extent, using interagency mechanisms such as IATI that can serve multiple reporting functions, can be advantageous and, potentially, save on overall reporting demands.
Is there a need to track the whole of cash response system and consider financial assistance overall? Limiting tracked CVA to interventions funded from IHA sources is increasingly seen as only providing part of the picture of assistance to crisis-affected populations. There have been growing calls to better understand the volumes of cash assistance delivered via social protection programmes and systems which have the objectives of mitigating and alleviating the impacts of, and aiding recovery from, humanitarian crises. How and where the lines might be drawn to designate assistance as broadly humanitarian in intent and design would likely be contested, and variable, but it remains under-researched. The primary value is the possibility of a more comprehensive understanding of the support being provided to affected populations, to better plan and target assistance, and identify gaps. Hence, identifying close to real-time mechanisms to inform ongoing response planning is of greater benefit than, for example, simply being able to quantify this assistance after the fact.
Priority actions
In relation to the strategic debates above and other key findings in this chapter, the following are recommended as priority actions for stakeholders.
- All stakeholders should work together, across organizations, sectors, and responses to leverage opportunities to increase the use of CVA where feasible and appropriate. This includes fostering and engaging in internal and external policy processes to ensure commitments for more and better CVA are developed and/or maintained and implemented.
- Implementing organizations should report their programming (both CVA and other modalities) to interagency platforms, making investments to ensure this can become a standard procedure in time. Reporting to IATI should be prioritized given its capacity to capture data in alignment with CVA tracking minimum requirements, and track funding flows to local and national actors via intermediaries.
- The global Cash Advisory Group should define and assign responsibilities for tracking CVA within the new cash coordination model. Clear guidance should be given to CWGs and clusters on what response level data should be captured to support the objective of providing timely, granular, and publicly accessible data to inform more effective coordination, and feed into global reporting systems to enable consolidated analysis61. Donors should ensure sufficient resourcing to enable CVA information management functions can perform effectively
1. See the Methodology section for the methodology for calculating annual CVA volume data, and related caveats.
2. Overall programming costs comprise the amounts transferred to people, plus associated programme implementation and administrative costs. Extracting accurate programming costs can be challenging, depending on organizational systems, and programming arrangements (e.g., mixed modality projects). For example, only 12% of CVA organizational volume submissions for 2022 including associated programming costs. The average ratio across the entire sample with available data of transfer costs to overall CVA programming costs (79%) was applied to the remainder to generate the estimated global total of $US10.0 billion. This methodology – using a combination of actual programming costs (where available), and estimates based on the average ratio of available programming costs to transfers – has been applied consistently since CALP and Development Initiatives started collecting and collating this data in 2016
3. This percentage has been revised downwards from the 19% shared in previous Global Humanitarian Assistance reports and other publications as global volumes of humanitarian assistance were revised upwards in the OECD DAC 2021 full data release in December 2022.
4. Kreidler, C and Rieger, N (2022) Increasing the Use of Humanitarian Cash and Voucher Assistance. CALP Network
5. This is according to calculations by Development Initiatives and differs from figures presented in the Global Humanitarian Assistance (GHA) 2023 report due to updated FTS data and because IHA funding volumes in the GHA report are adjusted for inflation. Funding figures are presented in current prices to be more comparable with the data on global volumes of humanitarian CVA, which is also only available in current prices
6. These percentages are calculated using CVA figures that differ from the annual totals as they exclude interventions/funds that don’t count towards IHA – e.g., domestic RCRC CVA in donor countries, or GiveDirectly’s US programming.
9. Calculations in this section are based on a subset of 20 NGOs who submitted CVA data in both 2021 and 2022.
10. Planned MPC as per the Ukraine Humanitarian Response Plan is lower for 2023 as compared to 2022, and as of July 2023 was only 27% funded. According to the Ukraine MPC Dashboard, US$247.5 million has been disbursed as of May 2023, as compared to US$1.18 billion in total in 2022. If 2023 levels were to match 2022, a higher volume might be expected at this stage.
11. https://phf.tbe.taleo.net/phf04/ats/careers/v2/viewRequisition?org=DAINC&cws=48&rid=7733
12. E.g., the annual CVA data collection (by CALP and Development Initiatives) for 2020 included self reports from several NGOs that the pandemic drove an increase in CVA due to its suitability for remote programming, particularly via digital channels.
13. N.B. Data on sub-grants is requested as part of the annual CVA data collection, but relatively few organizations can provide it due to difficulties accurately extracting this data from their respective systems. The total recorded volume of sub-grants for CVA through surveys was US$291 million in 2022. Several organizations reported this is something they are working to improve.
14. E.g., in the 2022 data collection, only two organizations specifically mentioned they do this, although as it wasn’t a direct question, there could feasibly be others.
15. Development Initiatives (2022) Tracking Cash and Voucher Assistance. Development Initiatives
16. In March 2023, the Grand Bargain Caucus on Funding to Local and National Actors endorsed an agreement to measure direct and indirect funding to local and national actors and to report all funding to publicly available platforms. If actioned, this has the potential to significantly increase transparency and understanding of who does what, and where. [Source: GHA 2023] Development Initiatives (2023) Global Humanitarian Assistance Report 2023. Development Initiatives
17. Development Initiatives (2023) Global Humanitarian Assistance Report 2023. Development Initiatives
18. Development Initiatives(2022) Tracking Cash and Voucher Assistance. Development Initiatives
19. CALP and DG ECHO (2020) Tracking Cash and Voucher Assistance: Agreements, recommendations and minimum requirements from the Grand Bargain cash workstream. CALP Network
20. See, for example, previous State of the World’s Cash reports for more on the primary policy focus on cash assistance, rather than vouchers, including in the Grand Bargain.
21. Development Initiatives (2022) Tracking Cash and Voucher Assistance. Development Initiatives
22. Percentages calculated here are based only on the subset of organizations that were able to provide disaggregated cash and voucher data for the given year, although in each case this comprises a majority of those reporting.
23. UNWFP Dashboard
24. NB. WFP’s CVA data in this report includes both commodity vouchers (US$218 million in 2022) and value vouchers in the voucher and combined CVA totals. As of 2022, WFP does not include commodity vouchers within their internal categorization for CVA. With commodity vouchers removed from the data, WFP’s cash/voucher split is 71%/29% (as compared to 67%/33% with commodity vouchers included).
25. GPPi (2016) Drivers and Inhibitors of Change in the Humanitarian System, p. v.
26. Kreidler, C and Rieger, N (2022) Increasing the Use of Humanitarian Cash and Voucher Assistance. CALP Network
27. Kreidler, Corinna, and Glyn Taylor (2022) Where Next? The Evolving Landscape of Cash and Voucher Policies. CALP Network.
28. Kreidler, C and Rieger, N (2022) Increasing the Use of Humanitarian Cash and Voucher Assistance. CALP Network
29. Ibid.
30. Ibid.
31. Ibid.
33. For example, donors such as Japan and France have been identified as being reticent to fund cash assistance, but there is evidence of easing of conditions and increases in support in 2022, with specific mention of Ukraine. [see Grand Bargain Self Reports 2022-23]
34. Kreidler, C and Rieger, N (2022) Increasing the Use of Humanitarian Cash and Voucher Assistance. CALP Network
36. SOWC 2020 summarizes the Common Donor Approach (CDA), and the Joint Donor Statement on Humanitarian Cash Transfers (JDS), published in 2019 and foundational to approaches to collaboration amongst signatory donors.
37. SOWC 2020 summarizes the Common Donor Approach (CDA), and the Joint Donor Statement on Humanitarian Cash Transfers (JDS), published in 2019 and foundational to approaches to collaboration amongst signatory donors.
38. Kreidler, C and Rieger, N (2022) Increasing the Use of Humanitarian Cash and Voucher Assistance. CALP Network
39. Ibid.
40. Ibid
41. Development Initiatives (2023) Global Humanitarian Assistance Report 2023. Development Initiatives
43. A case study analysis of the potential to increase CVA in Yemen highlighted that donor fatigue and declining funding as a result of other crises was a major challenge to even maintaining current levels of CVA programming (Kriedler and Rieger, 2022)
45. Kreidler, Corinna, and Glyn Taylor (2022) Where Next? The Evolving Landscape of Cash and Voucher Policies. CALP Network.
46. Ibid.
47. Development Initiatives (2022) Tracking Cash and Voucher Assistance. Development Initiatives
48. Kreidler, Corinna, and Glyn Taylor (2022) Where Next? The Evolving Landscape of Cash and Voucher Policies. CALP Network.
49. Ibid.
50. Key issues affecting tracking at the systems level are explored and summarized in Gordon, L. (2018) Measuring Cash Transfer Programming – Scoping Study. Oxford: CALP and SOWC 2020
51. CALP and DG ECHO (2020) Tracking Cash and Voucher Assistance: Agreements, recommendations, and minimum requirements from the Grand Bargain cash workstream. CALP Network
52. Development Initiatives (2022) Tracking Cash and Voucher Assistance.
53. Kreidler, C and Taylor, G (2022) ibid.
54. Development Initiatives (2022) Tracking Cash and Voucher Assistance. Available at:
55. Development Initiatives (2022) Tracking Cash and Voucher Assistance.
56. Gentilini, U (2022) Cash Transfers in Pandemic Times: Evidence, Practices, and Implications from the Largest Scale Up in History. Washington, DC: World Bank. ©World Bank.
57. Ibid.
58. Whole of Cash Response System definition (CALP glossary): The whole of cash response system comprises all the existing interventions that provide cash transfers or vouchers to the same group of crisis-affected households in a given geographical area. The whole of cash response system can be composed of one or several operational models.
59. P. Harvey et al. (2022) Floods in Pakistan: Rethinking the humanitarian role. Humanitarian Outcomes.
60. Development Initiatives (2022) Tracking Cash and Voucher Assistance.
61. Recommendation adapted from Development Initiatives (2022) Tracking Cash and Voucher Assistance – ibid.


