Cash and Markets Monthly Dashboard DRAFT April 2017
• The cash and markets, monthly dashboard presents current data on market prices of key commodities and the cost of the minimum expenditure basked (MEB) across Somalia. In addition, it also provides key highlights relevant to cash and market interventions.
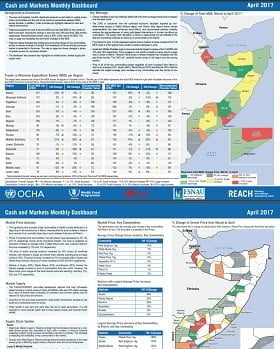
• Page one presents the cost of the food MEB and the total MEB for the months of March and April, showing the change in cost over one (1M) and three (3M) months respectively. Recommended transfer value is 80% of the cost of the MEB. The map on page one illustrates the one month changes to the MEB.
• Page two tables illustrates the market price and price change of key commodities across monitored markets in Somalia. Full breakdown of the commodity prices per market is presented in the annex. The map on page two shows changes in prices of cereals across the monitored markets.
• The dashboard also presents key highlights on market prices, market supply and supply chain.


